Flow sensitive 4D MRI
Waltraud Buchenberg
4D flow MRI is one of the main research topics for the Cardiovascular group and we have many collaboration partners, both within the Uniklinik and in external organisations. The research can be split into three broad areas: improvements to the imaging process, development and improvement of methods to extract information from the data and application of the technique.
Imaging methods
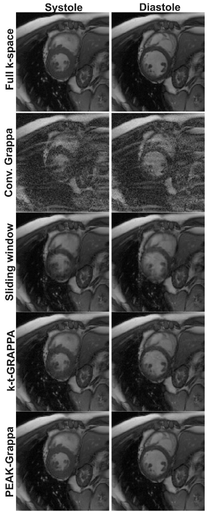
MRI imaging methods are inherently slow which causes problems when imaging moving structures such as the heart or aorta. Increasing the efficiency and therefore the speed of the acquisitions is therefore particularly important for cardiovascular applications. PEAK-GRAPPA [1] is an example of a method, developed within the group, which allows acceleration of imaging without loss of image quality.
PEAK-GRAPPA
The figure shows images from two parts of the cardiac cycle (systole and diastole) reconstructed using full k-space data (top) and with a factor of 6 acceleration using various different methods: conventional GRAPPA, sliding window, k-t-GRAPPA, and PEAK-GRAPPA. PEAK-GRAPPA is able to reconstruct images from factor 6 undersampled data which are comparable in quality to the fully sampled reconstruction, without significant temporal blurring. Taken from [1].
Image processing
A 4D flow dataset contains a huge amount of information which needs to be carefully processed in order to extract the useful information. The data must first be corrected for certain errors which remain, such as those caused by eddy currents, velocity aliasing, noise and higher order motion effects. Once correction has been performed, various parameters can be quantified. As well as the encoded velocities, derived parameters such as pressure, wall shear stress and helicity of flow can also be extracted from the data.
Pre-processing
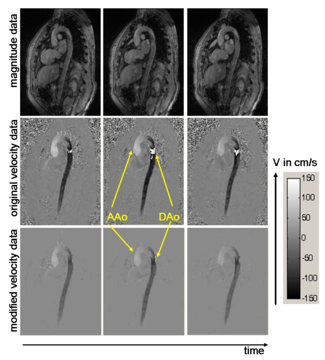
The figure shows images of ascending (AAo) and descending (DAo) aorta. The anatomy is represented by magnitude images (upper row) and blood flow velocity by phase images (middle row). In the bottom row, phase images after pre-processing are shown. This modified data exhibit reduced noise and initially aliased blood flow velocities have been successfully corrected.
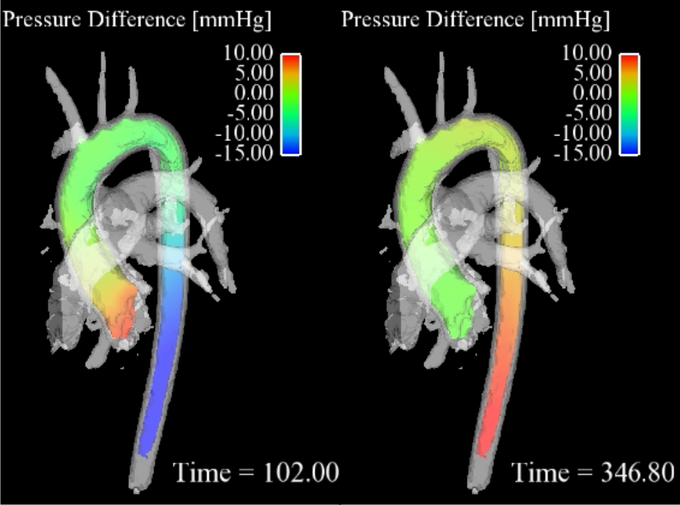
3D pressure mapping in a healthy aorta in systole (right) and diastole (left). Note the pressure inversion during diastole.
Pressure mapping
Cardiovascular pressure gradients are an important clinical marker for the evaluation of the severity of diseases such as aortic valve stenosis and aortic coarctation [2]. In the clinical routine, pressure gradients are determined via in vivo catheter measurements or alternatively via Doppler ultrasound. However, these methods have some disadvantages such as radiation exposure for catheter guidance or operator dependency and errors from poor acoustic window and spectral broadening for ultrasound.
Alternatively, the time-resolved velocity field measured with 4D flow MRI (time-resolved three-directionally encoded phase contrast MRI) can be used to derive relative pressure gradients via the Navier-Stokes equation [3]. This approach is non-invasive and without user-dependency and allows time-resolved pressure maps to be derived in any vessel of interest.
For further details please refer to Bock J, Frydrychowicz A, Lorenz R, Hirtler D, Barker AJ, Johnson KM, Arnold R, Burkhardt H, Hennig J, Markl M. In vivo noninvasive 4D pressure difference mapping in the human aorta: phantom comparison and application in healthy volunteers and patients Magn Reson Med. 2011 Oct;66(4):1079-88
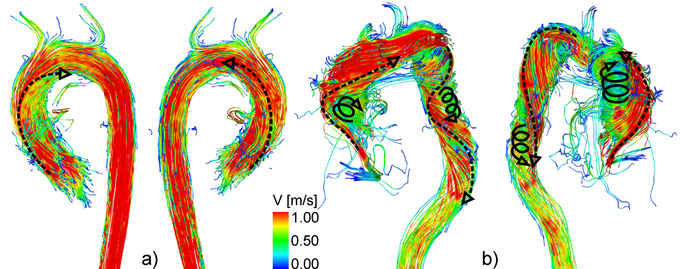
3D flow characteristics in a healthy volunteer (a) and a patient with aortic valve disease (b). Note the increased helical flow in the entire aorta.
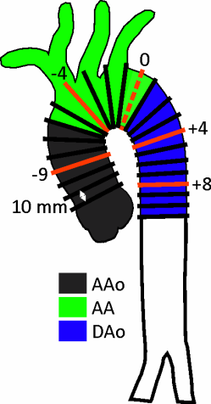
Distribution of 2D planes over the aorta for helicity quantification.
Helicity quantification
3D blood flow characteristics within the aorta are complex and dependent on the individual geometry and shape of the aorta. Helical flow, a corkscrew-like motion about the principal flow direction, is considered to be a normal feature in healthy subjects (above figure, a) [4-8]. Due to altered aortic outflow resulting from aortic valve disease, helical flow has been shown to increase (above figure, b) [9, 10]. Previous in vivo investigations of aortic helicity were based on the qualitative evaluation of helical flow using 2D vector arrow plots or 3D streamlines and 3D pathlines, which provide a visual impression of the magnitude and sense of rotation [6, 10-12]. However, it is challenging to visually analyze helix flow over the entire aorta and cardiac cycle. Helical flow patterns can be overlooked in a visual inspection. Moreover, such an analysis and classification of helical flow could remain observer-dependent.
A new method for the quantification of aortic helicity could help to clearly identify the direction of rotation and the intensity of the helicity at specific locations and time points within the cardiac cycle. The aim of this study was to test the feasibility of quantitative analysis of helicity, using equidistantly distributed 2D planes and to quantify the spatial distribution and temporal dynamics of helix flow in the entire thoracic aorta (left figure ).
For further details see: 4D flow magnetic resonance imaging in bicuspid aortic valve disease demonstrates altered distribution of aortic blood flow helicity. R Lorenz, J Bock, A J Barker, F von Knobelsdorff-Brenkenhoff, W Wallis, J G Korvink, M M Bissell, J Schulz-Menger, M Markl. Link to pubmed: www.ncbi.nlm.nih.gov/pubmed/23716466
Applications
Congenital Heart Disease
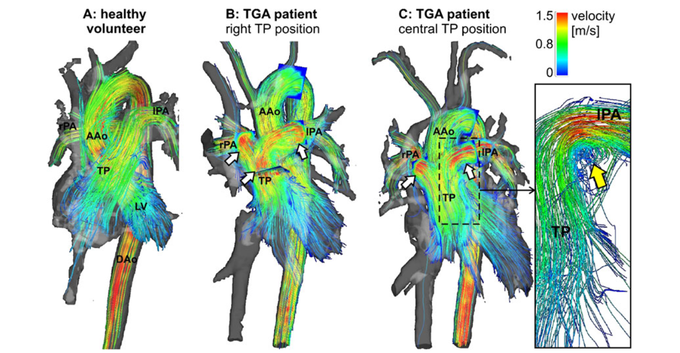
The complex geometries of the cardiovascular system in patients with congenital heart disease lend themselves perfectly to being studied using comprehensive 4D flow measurements. The image shows an overview of 3D haemodynamics in healthy volunteers (a) compared with patients with transposition of great arteries (TGA) visualised by colour-coded stream-lines. High systolic flow velocity in the pulmonary trunk (TP) and pulmonary arteries are visible in both patients (b,c). (c) Vortical flow can be seen at the transition of the TP to the left pulmonary artery (lPA) in a TGA patient with straight anterior TP position. LV: left ventricle, AAo: ascending aorta, DAo: descending aorta. Taken from [13].
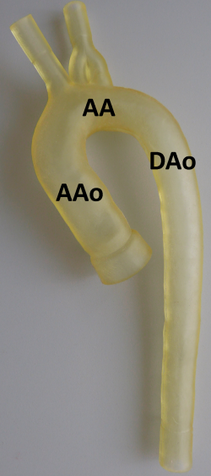
In vitro model of the thoracic aorta manufactured with rapid prototyping.
In vitro models
Progression of vascular diseases (such as aortic coarctation, aneurysms and vessel wall stiffness) is typically associated with complex hemodynamic alterations. To understand the correlation of vascular diseases and hemodynamic changes longitudinal studies could aid in answering such questions. However, these studies are difficult to control for severity (e.g. stenosis grade) and to systematically evaluate changes in hemodynamic.
An alternative way to approach this problem are phantom studies allowing well-defined MRI experiment implementing realistic in vitro vessel models and flow pumps while using phase contrast (PC) MRI for flow analysis. An important aspect for the successful in vitro simulation of flow characteristics is related to the generation of realistic inflow and pressure boundary conditions. In vitro models were manufactured using rapid prototyping [14] and resemble one-to-one replicas of the normal or pathological (e.g. ascending aortic aneurysm, aortic coarctation and arteriosclerosis) thoracic aorta derived from previously acquired MRI data (left figure).
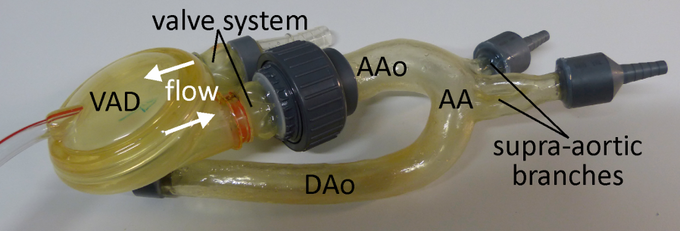
Ventricular assist device (VAD) attached to the ascending aorta of the in vitro model
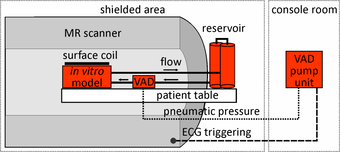
Experimental set up for in vitro flow measurements
In this study a pneumatically driven MR compatible ventricular assist device (VAD, MEDOS Medizintechnik AG, Germany) was used as pump device (above figure). It is clinically used in heart failure patients to support the left and/or the right ventricle of the heart [15]. The VAD consists of a ventricular pump chamber including valve regulated in- and outflow and, since it is clinically used in patients, permits the generation of pulsatile flow comparable to real in vivo conditions. The VAD, mimicking the beating heart, can therefore be used to generate an easy to handle, small and closed flow circuit for in vitro flow measurements (right figure).
Technical Flows
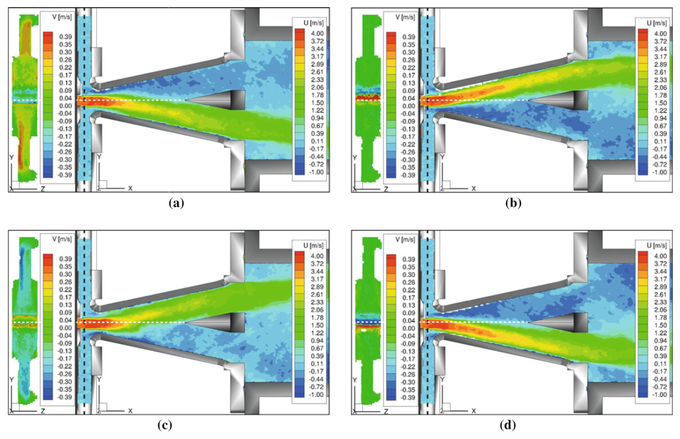
4D MRI measurements in technical flows allows unprecedented access to the internal workings of technical devices which are often optically opaque. An example of flow distributions in a bi-stable fluidic oscillator at several stages in the oscillation cycle is shown in the image (taken from [16]). Good agreement was found with laser Doppler anemometry, and new insights into the flow mechanisms within the oscillator were gained due to the comprehensive nature of the flow measurements.
References
[1] Parallel MRI with extended and averaged GRAPPA kernels (PEAK-GRAPPA): optimized spatiotemporal dynamic imaging. Jung B et al, J Magn Reson Imaging. 2008 Nov;28(5):1226-32. doi: 10.1002/jmri.21561
[2] J.N. Cohn, A.A. Quyyumi, N.K. Hollenberg, and K.A. Jamerson. Surrogate markers for cardiovascular disease. Circulation, 2004,109:31-46. [2] J. M. Tyszka, D. H. Laidlaw, J. W. Asa, and J. M. Silverman. Three-dimensional, time-resolved (4d) relative pressure mapping using magnetic resonance imaging. J Magn Reson Imaging, 12(2):321-329,2000
[3] 4D flow magnetic resonance imaging in bicuspid aortic valve disease demonstrates altered distribution of aortic blood flow helicity Lorenz R et al, Magn Reson Med. 2013 May 28. doi: 10.1002/mrm.24802.
[4] H.G. Bogren et al. 4D magnetic resonance velocity mapping of blood flow patterns in the aorta in young vs. elderly normal subjects. J Magn Reson Imaging, 1999; 10(5):861-869.
[5] M.H. Buonocore et al. Analysis of flow patterns using MRI. International journal of cardiac imaging, 1999; 15(2):99-103.
[6] P.J. Kilner et al. Helical and retrograde secondary flow patterns in the aortic arch studied by three-directional magnetic resonance velocity mapping. Circulation, 1993; 88(5 Pt 1):2235-2247.
[7] W.A. Seed et al. Velocity patterns in the aorta. Cardiovascular research, 1971; 5(3):319-330.
[8] L. Segadal et al. Blood velocity distribution in the human ascending aorta. Circulation, 1987; 76(1):90-100.
[9] M.D. Hope et al. Bicuspid aortic valve: four-dimensional MR evaluation of ascending aortic systolic flow patterns. Radiology, 2010; 255(1):53-61.
[10] M.D. Hope et al. 4D flow CMR in assessment of valve-related ascending aortic disease. Jacc, 2011; 4(7):781-787.
[11] A. Frydrychowicz et al. Time-resolved, 3-dimensional magnetic resonance flow analysis at 3 T: visualization of normal and pathological aortic vascular hemodynamics. Journal of computer assisted tomography, 2007; 31(1):9-15.
[12] A. Frydrychowicz et al. Flow-sensitive 3D magnetic resonance imaging reveals complex blood flow alterations in aortic Dacron graft repair. Interactive cardiovascular and thoracic surgery, 2006; 5(4):340-342.
[13] 4-D MRI flow analysis in the course of interrupted aortic arch reveals complex morphology and quantifies amount of collateral blood flow. Hirtler D et al, Pediatr Radiol. 2013 Aug;43(8):1037-40. doi: 10.1007/s00247-013-2641-1
[14] M. Markl el al. Rapid vessel prototyping: vascular modeling using 3t magnetic resonance angiography and rapid prototyping technology. Magma, 2005; 18(6):288-292.
[15] M. Markl et al. Three-dimensional magnetic resonance flow analysis in a ventricular assist device. J Thorac Cardiovasc Surg, 2007; 134(6):1471-1476.
[16] Phase-locked 3D3C-MRV measurements in a bi-stable fluidic oscillator. Wassermann et al, Experiments in Fluids March 2013, 54:1487
Prof. Dr. Dr. h.c. Jürgen Hennig
Tel.: +49 761 270-74120
University Medical Center Freiburg
Dept. of Radiology · Medical Physics
Killianstr. 5a
79106 Freiburg


